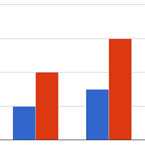
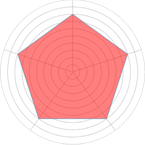
Graph Generator for easy creation of pie charts, radar charts, bar chart images

This is recommended for those who want to prepare pie, radar and bar chart images easily without using Excel. Operation is easy! Just enter the data and press the image generation button. Since graph reviews are linked, you can generate graphs while checking the graphs. First, select the graph you want to create.

Important things when using graphs

  • 1. Clarify the message you want to convey
  • 2. Compare to represent the size of the data
  • 3. Think about what form can best express the message

Don't use pie charts

  • 1. Not suitable for comparing sizes
  • 2. The data are adjacent and require many colors
  • 3. Labels are messy

3D graphs not used

  • 1.The size changes with depth
  • 2. I don't know where the axis is running

The second axis is not used

Used when you want to show the relevance of two data at the same time, Although it looks reasonable at first glance, it is difficult to determine at a glance which graph the Y-axis scale belongs to, which is thought to lead to cognitive burden.

Write key messages the largest

If you look at the graph without a clear message, the receiving mental model will interpret the graph in any way. As a result, even if it is misunderstood or understood, it leads to wasting cognitive load.

Numbers are right-justified with decimal places

Occasionally you may see a table that is broken in numbers after the decimal point or not right-justified, but be aware that it will turn into a table that your brain will refuse to see in an instant.

Axis label not tilted

Studies have shown that the time it takes to recognize a letter increases as the letter is tilted from the horizontal, and it takes up to 52% at 45 ° and 205% more at 90 °.

Quoted source

Social Share